Every couple of months I see a question come around where someone has a jQuery event handler that’s being fired but they don’t know where that is in their codebase.
So your first stop is the browser dev tools but then you hit something like this:
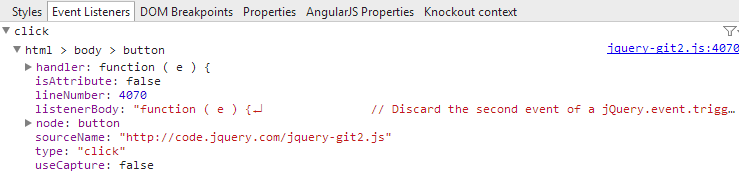
Well crap, that’s not particularly helpful, it just shows us something in jQuery, and if I’m using a minified version of jQuery well then I’m really in trouble, it won’t be easy to debug at all.
Ok that’s not really helpful now is it, it’s not showing my event handler, it’s showing me something from jQuery internals.
The why
To understand why we’re not seeing our event handler we need to understand a bit about how browser events work. Originally you were only able to attached a single event handler to any given DOM element, and that was like this:
element.onclick = function () { ... };
Before we had addEventListener everywhere jQuery gave us a way to add multiple events, by attaching its own event handler and capturing your listeners into an array so that when the event does fire it can loop over them all and trigger them.
Debugging the unknown
Right-o so our event handlers are hidden away behind a wrapper that triggers them from a generic function, that could pose a problem couldn’t it?
Conveniently jQuery offers a bit of a backdoor into its internals which we can leverage for this purpose, and that’s $._data.
It’s worth pointing out that $._data is an “internal” jQuery API which is undocumented, it might be removed one day so use it with caution.
This method takes 3 arguments, but for our purpose we’re really only interested in the first, which is a DOM element. Not that this is a DOM element and not a jQuery element, passing in a jQuery element will not yield the results you desire.
Fun fact, to get to the DOM element from a jQuery selector access its array index - $('.foo')[0].
Now, calling $._data will return us an object, like so:
$._data(document.getElementById('myElement')); // -> { events: { ... }, ... }
There’s a bunch of properties on this returned object but the one we’re interested in is the events property. This property is an object that has properties representing all the event handlers which you have attached, so something like this:
{
    events: {
        click: []
    }
}
From this array we now have access to all our click handlers, they’ll look something like this:
{
  data: null,
  guid: 1,
  handler: function () { ... },
  namespace: "",
  needsContext: undefined,
  origType: "click",
  selector: undefined,
  type: "click"
}
Awesome, there’s your event handler, it’s on the handler property, copy that text and search your codebase for it.
Actually debugging
Right so we’ve found our event handler, or at least a text version of it, it’d be better if we could actually step into it, find out which file we’re coming from. Wouldn’t it be cool if we could insert breakpoints?
We can do that with some tricks:
(function () {
    var element = $('.selector')[0]
    var clicks = $._data(element).events.click;

    clicks.forEach(function (click) {
        var handler = click.handler;

        click.handler = function () {
            debugger;
            handler.apply(this, arguments);
        };
    });
})();
Do you see what we’re doing from our simple function? We’re:
- Getting all our click handlers and looping over them
- Capturing the original handler into the
handlervariable - Creating a new handler which uses the
debuggerkeyword to attach a JavaScript debugger - Using
applyto invoke the handler with the expected arguments
Now we get a breakpoint which we can step into our event handler with!