One of the new features in the F12 refresh is some improvements to the JavaScript debugger so let’s have a look at those updates.
Source maps

Haven’t heard of source maps? Well then you should start here, but basically source maps are a way to provide debugging information from generated JavaScript output, either generated from a transpiler or from a minifier.
Over the last 12 months in particular source maps have really taken off and they can really make it easy to solve problems without needing the direct sources, which as a .NET developer this is something that I’ve grown up using.
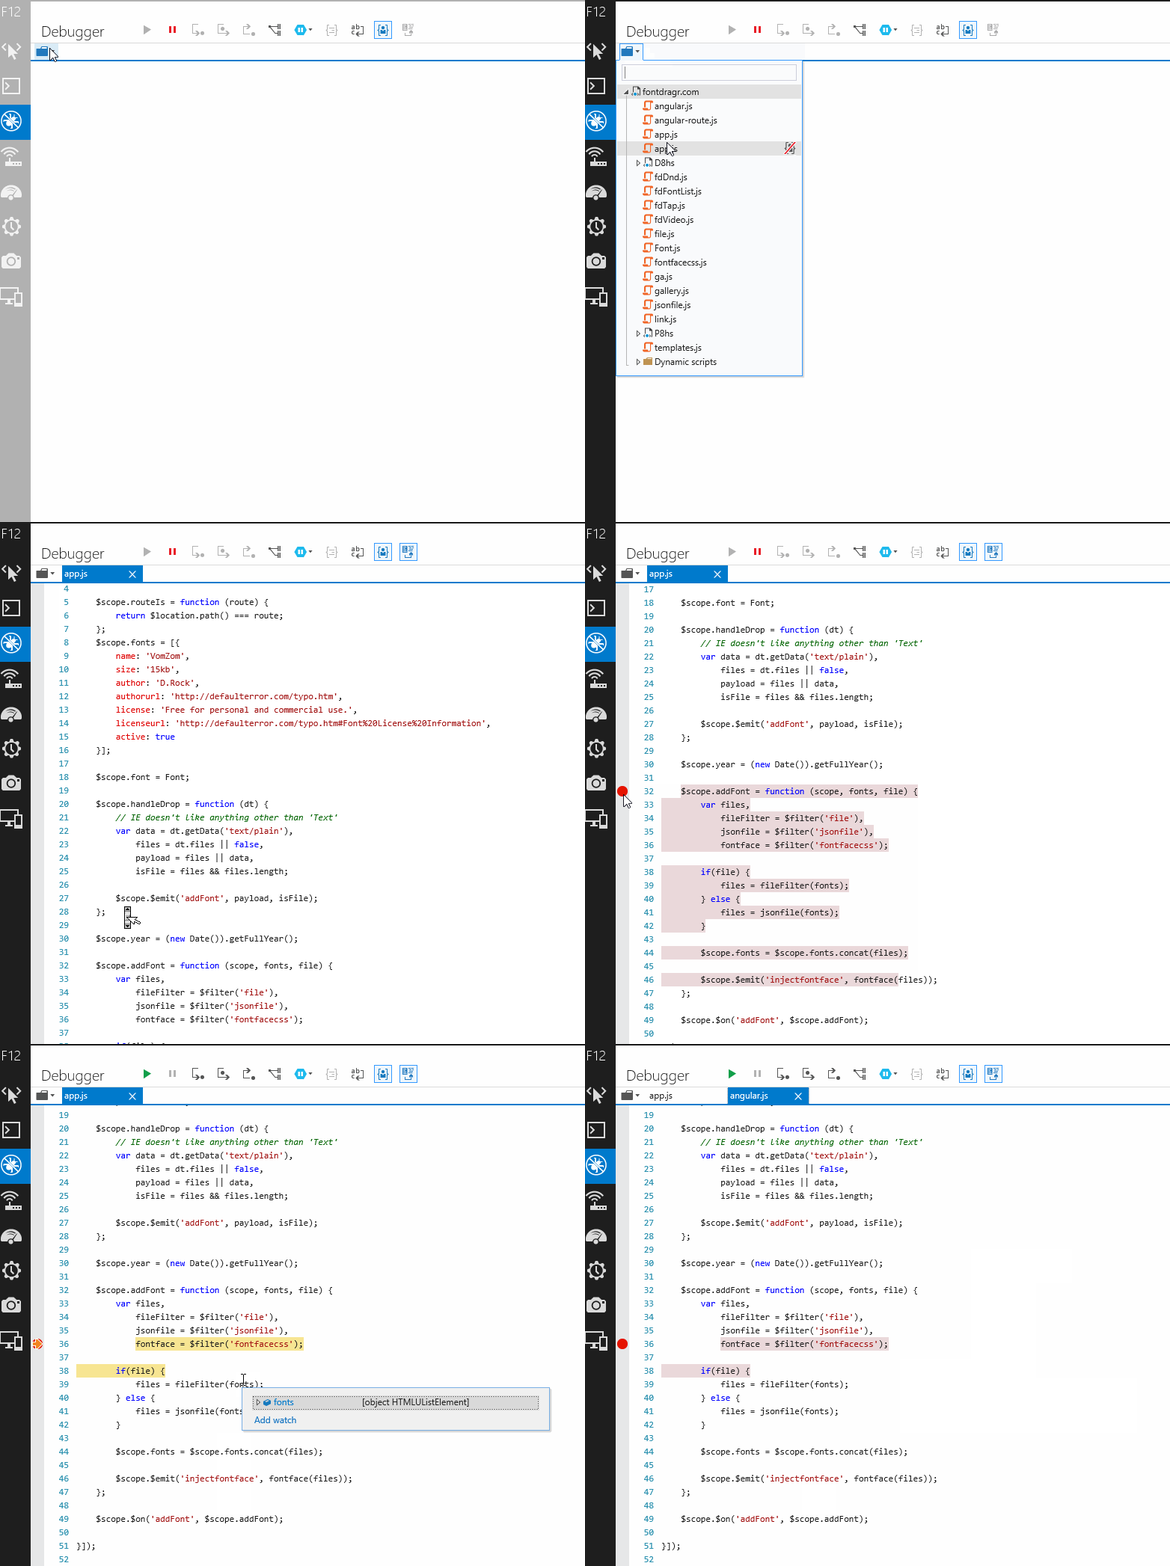
I’m excited that this has been included in the F12 refresh which has just dropped. By default they are turned on when you’re in the script debugger so you immediately start debugging your original sources rather than the generated sources and having to opt into source maps:

In the above I’m debugging the source of a website called font dragr by @ryanseddon which is an AngularJS app that was minified with UglifyJS2 which is a minifier that will generate a source map for the minified file. You can see in the source list there it multiple files listed, but if you look at the HTML only a single JavaScript file is served, named scripts.js. So far it seems there are a few issues still, the breakpoint positioning can be a bit iffy (as you can see above) and debugging doesn’t seem to track variable names properly so the locals and console will respond to the minified name rather than the original. I asked the F12 team about this and apparently it’s to do with a limitation in the source maps spec, there’s not enough data to map the variable names so it’s something we’re stuck with at the moment.
There’s a few other nice things about the source maps implementation, there’s a button on the toolbar which will allow you to swap between original and “decompiled” sources, so if you don’t know what the generated variable name is you can swap to the original source, turn on pretty print and look at it before going back to the source map debugger.
They’ve also included some syntax highlighting for popular transpiler languages like CoffeeScript and TypeScript to make the debugging experience nicer. If you’re using other languages, say Traceur or Sweet.js, you’ll just lack syntax highlighting for the debugger. Also when you have source maps turned on the search will search the source mapped code, not the original source.
Just My Code debugging
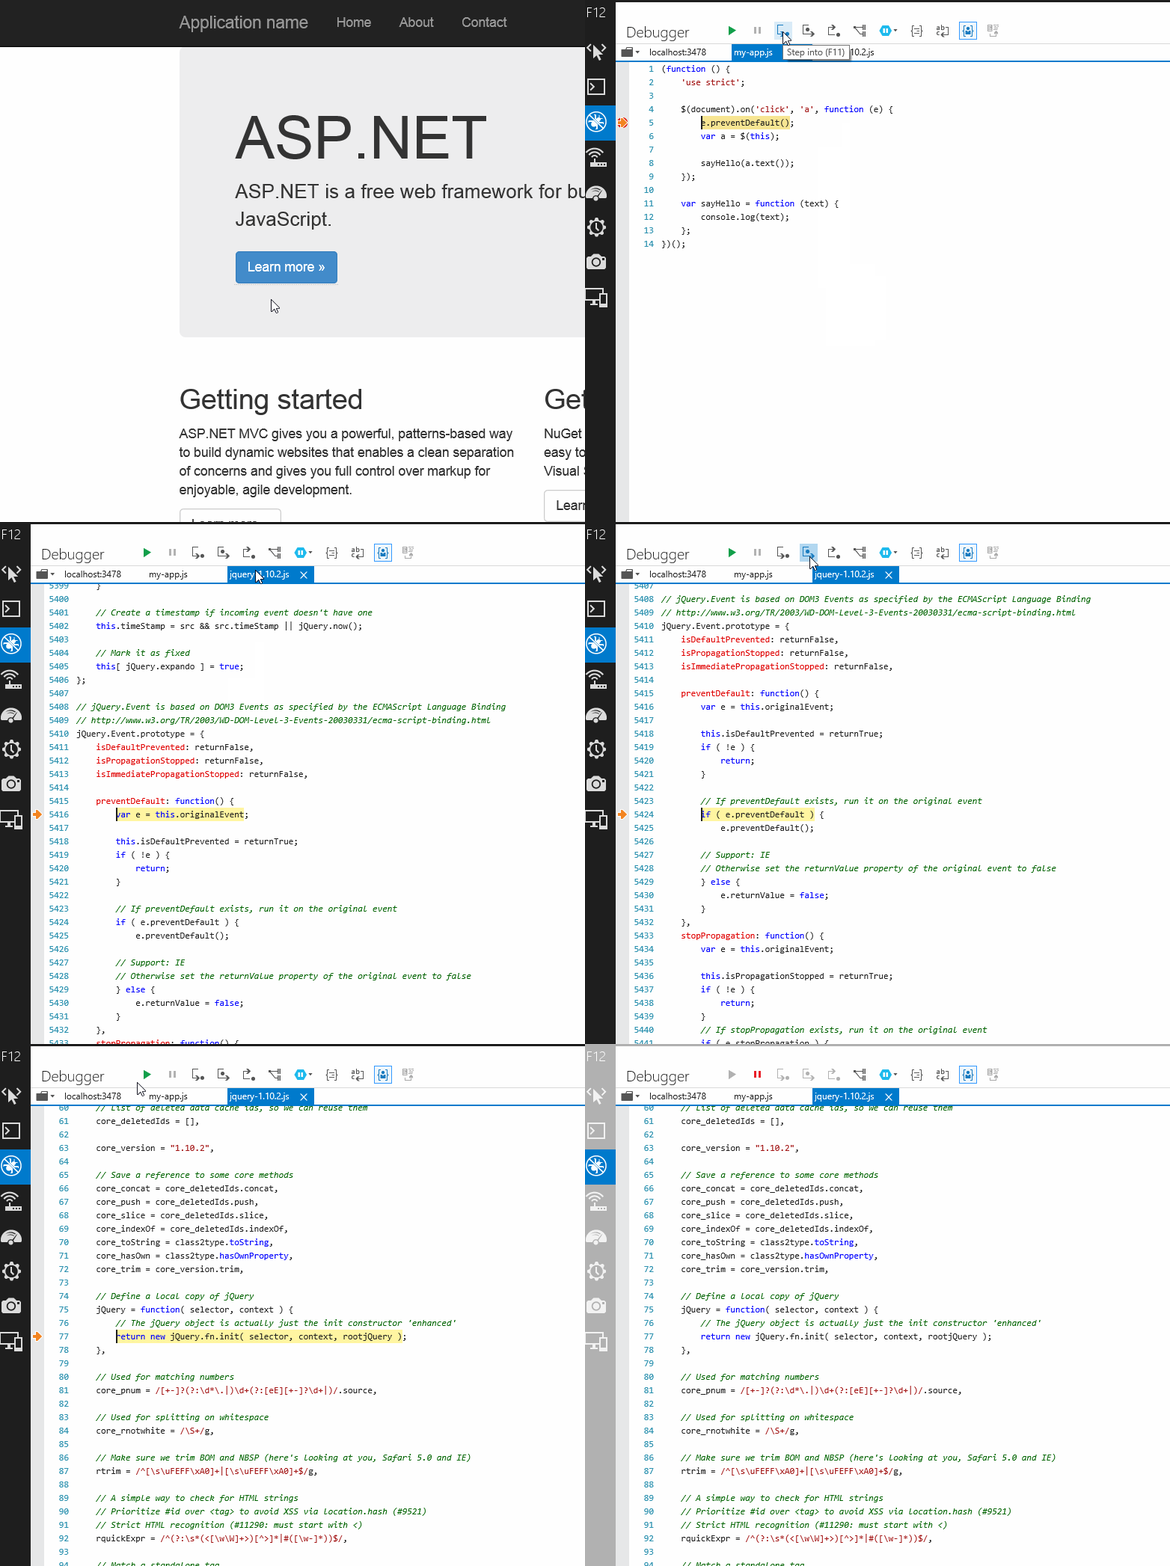
How many times have you been debugging JavaScript and had this happen:

Yep you’ve accidently clicked Step Into and found yourself inside jQuery/AnguarJS/etc which you now want to get back out of because you’re not really wanting to debug these libraries. You go to swap back up the callstack to your code but get the breakpoint wrong and continue past where you were trying to debug anyway.
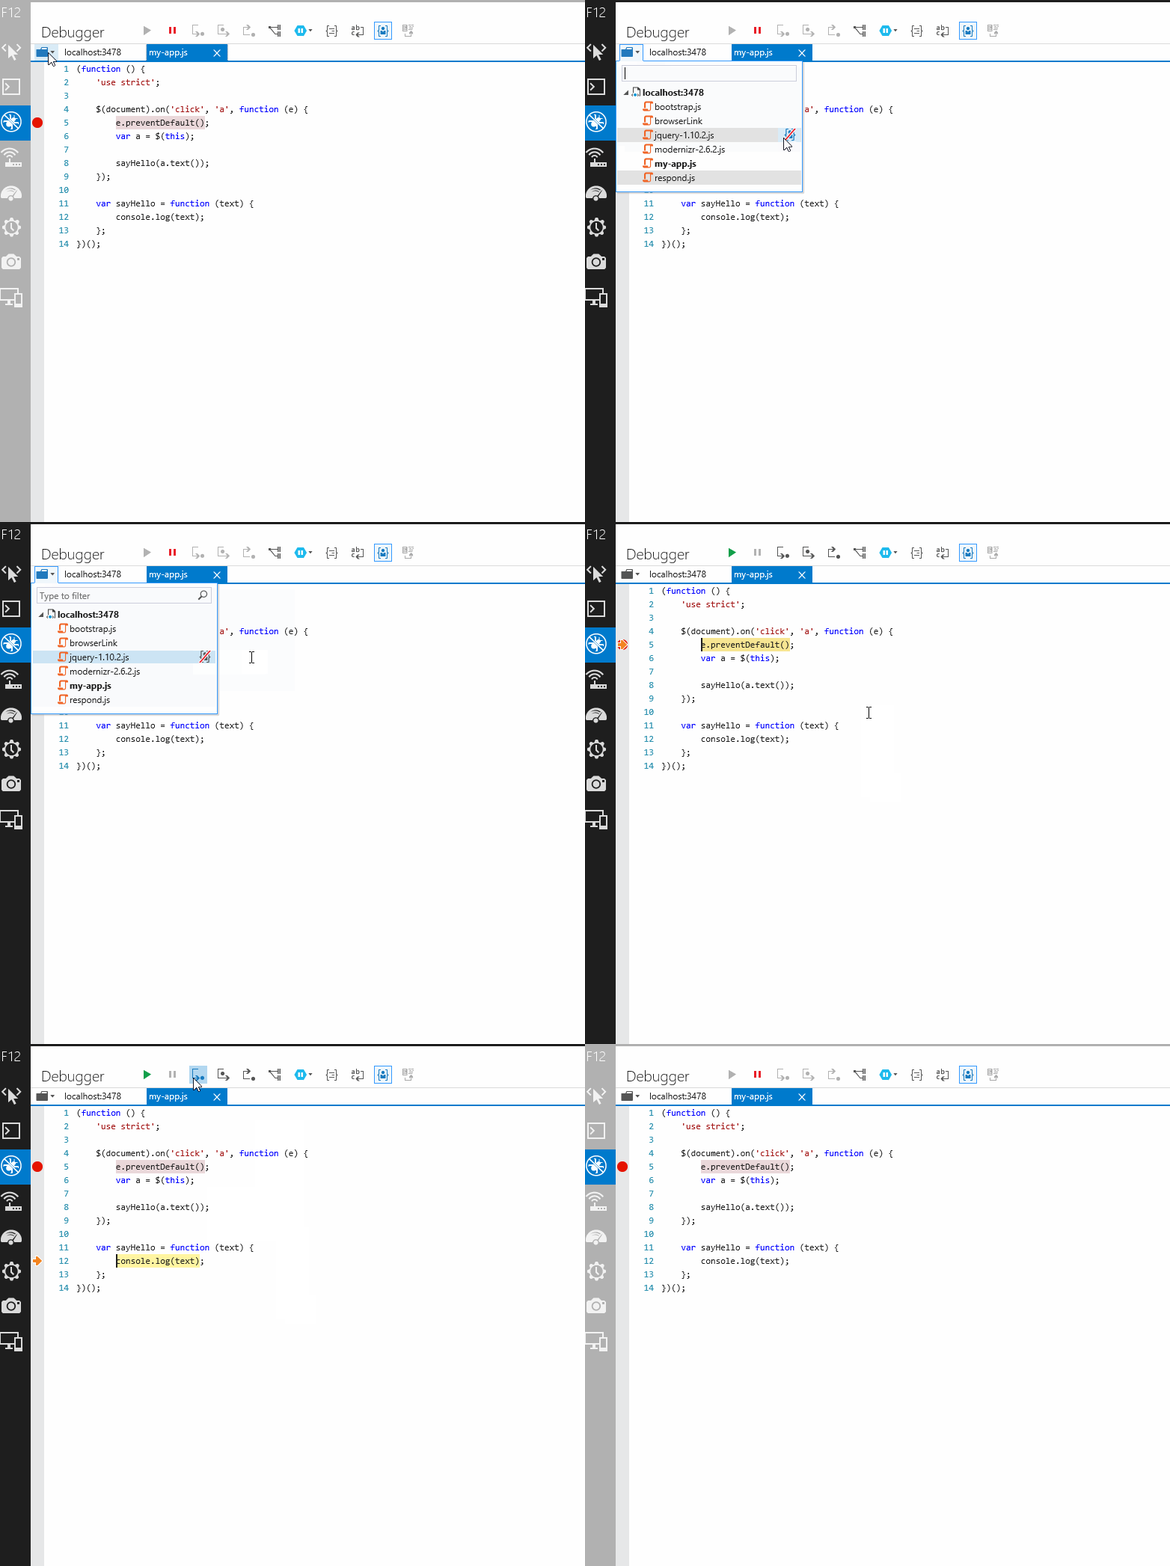
Well with the F12 refresh there is a really cool new feature which allows you to make script files as library files and when they are marked as such these scripts will be skipped by the debugger! They’ll also be hidden within the callstack as external code so you can see that your call has gone through code which is outside your control.

To enable this feature you need to open the list of scripts (Ctrl + O) and then click the option on the scripts you want marked as a library and ignored. As you can see above it will avoid any step-into calls you try and do and even run all the way through if you have no more code that isn’t marked as library code at the end. This can also be combined with source maps to skip over decomplied libraries.
Other minor improvements
There’s a few small improvements that are easy to miss, like the fact that breakpoints and watch variables are now remembered when you close the dev tools. Or that the console understands the debugging context and has autocomplete on what’s in scope.
Conclusion
That wraps up our look at some of the new features related to the style editor in Internet Explorer’s F12 tools. If you’ve got any feedback make sure you ping the @IEDevChat twitter account and let them know. Also don’t forget to checkout modern.ie to get trial versions of Windows with Internet Explorer.