There’s a very under rated feature in MS Edge’s F12 tools called tracepoints. A tracepoint is like a breakpoint but it calls console.log with the statement you provide it. This is really useful want to inspect some state as your application runs but don’t want to interupt the application flow by adding a breakpoint, or can’t modify your code and inject console.log statements (eg: production environments).
Well it turns out that we can easily simulate this in the Chrome dev tools (and I suspect Firefox too, but I don’t spend much time debugging in Firefox), and that’s by exploiting the conditional breakpoints
With a conditional breakpoint it runs what you give it and if it’s true you’ll have the application break, if it returns false it’ll continue on unabided. If we exploit type coersion in JavaScript we can call console.log as our conditional breakpoint statement and not return anything since console.log returns undefined which is coerced to false.
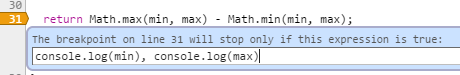
Another thing we can do is use the JavaScript comma operator which allows us to chain statements together, which each executed and the final of the chain being the returned value. If we combine this with the type coersion we can execute multiple console.log statements we can achieve something like this:
Nifty little trick, especially when debugging envuronments we can’t access.