As we’ve been looking at how to run GraphQL on Azure we’ve covered several topics of importance with Azure integration, but what we haven’t looked at is how we make sure that we are getting insights into our application so that if something goes wrong, we know about it. So for this post we’re going to address that as we take a look at logging using the Azure Application Insights platform (often referred to as AppInsights).
If you’re deploying into Azure in the ways that we’ve looked at in this series, chances are you’re already using AppInsights, as it’s the cornerstone of Azure’s monitoring platform, so let’s look at how to get better insights out of our GraphQL server.
Side note: There’s a lot more you can do with AppInsights in monitoring your infrastructure, monitoring across resources, etc., but that’ll be beyond the scope of this article.
Tracing Requests
Apollo has a plugin system that allows us to tap into the life cycle of the server and requests it receives/responds to, so that we can inspect them and operate against them.
Let’s have a look at how we have create some tracing through the request life cycle with a custom plugin.
We’ll need the applicationinsights npm package, since this is a Node.js app and not client side (there’s different packages depending if you’re doing server or client side JavaScript).
I’m also going to use the uuid package to generate a GUID for each request, allowing us to trace the events within a single request.
Let’s get started coding:
| |
Here’s the starting point. I’m making this a generic plugin that you can either pass in the Instrumentation Key for AppInsights, or an existing TelemetryClient (the thing you create using the npm package), which allow you create a unique client or share it with the rest of your codebase. I’ve also added an optional logName argument, which we’ll put in each message for easy querying.
Time to hook into our life cycle:
| |
The requestDidStart method will receive a GraphQLRequestContext which has a bunch of useful information about the request as Apollo has understood it, headers, the operation, etc., so we’re going to want to log some of that, but we’ll also enrich it a little ourselves with a requestId that will be common for allow events within this request and the logName, if provided.
You might be wondering why I’m doing headers in the way I am, that’s because context.request.http.headers is an Iterable and won’t get serialized properly, so we need to convert it into a standard object if we want to capture them.
We send this off to AppInsights using client.trackEvent:
| |
The name for the event will help us find the same event multiple times, so I’m using the life cycle method name, requestDidStart, and popping the current timestamp on there. Since I’m using trackEvent this will appear in the customEvents table within AppInsights, but you could use trackTrace or any of the other tables for storage, depending on how you want to query and correlate your logs across services.

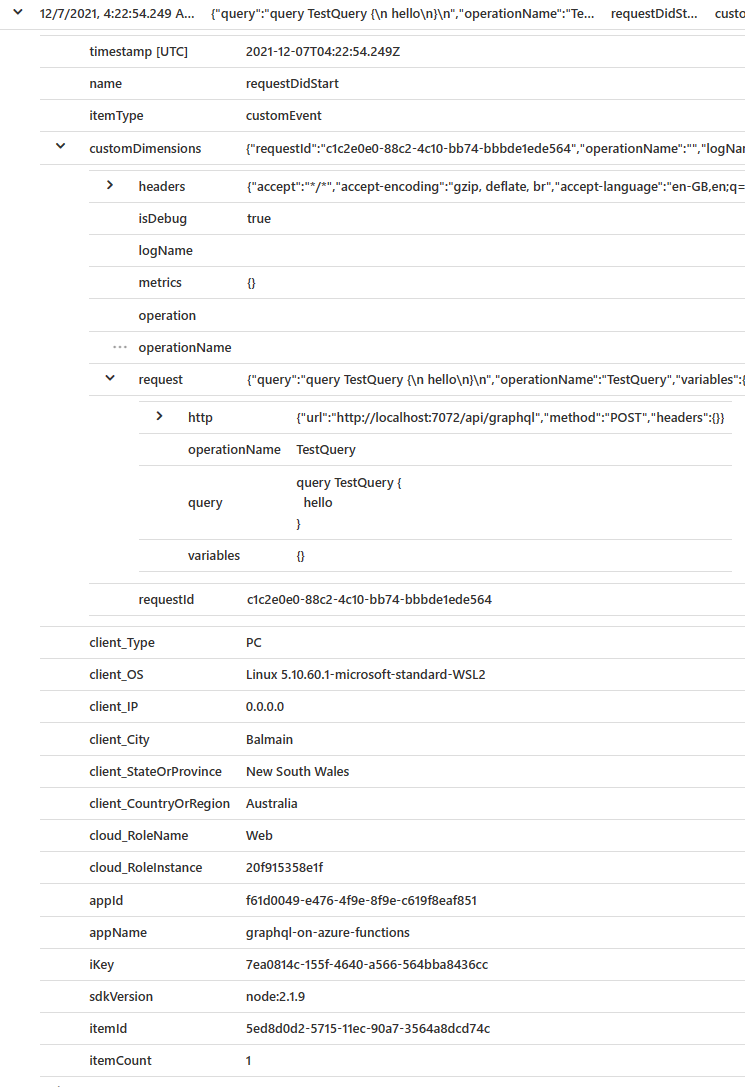
This is an example of how that will appear in AppInsights, you can see the custom information we’ve pushed, such as the GraphQL operation and it’s name, the headers, etc.
We could then write a query against the table for all operations named TestQuery:
customEvents
| extend req = todynamic(tostring(customDimensions.["request"]))
| where req.operationName == 'TestQuery'
The plugin can then be expanded out to cover each of the life cycle methods, pushing the relevant information to AppInsights, and allowing you to understand the life cycle of your server anf requests.
Conclusion
This is a really quick look at how we can integrate Azure Application Insights into the life cycle of Apollo Server and get some insights into the performance of our GraphQL server.
I’ve created a GitHub repo with this plugin, and it’s available on npm.
There’s another package in the repo, apollo-server-logger-appinsights, which provides a generic logger for Apollo, so that any logging Apollo (or third-party plugins) does will be pushed to AppInsights.
Happy monitoring!